

“The message is in the blood.”
Multi-gene mRNA expression analysis by RT-PCR, combined with machine-learning algorithms, distilled into a 0–100 score and an easily interpretable binary readout on clinically validated cutoffs.
Hundreds of measurements. One clear answer.
Our approach combines multi-gene mRNA expression analysis via RT-PCR with advanced machine-learning algorithms. Complex data becomes a score from 0–100, then a binary readout — positive/negative, detected/undetected, or high/low — based on clinically validated cutoffs.
The Central Dogma breaks down in cancer.
As NGS and digital pathology advanced, focus shifted to DNA and proteomics, leaving mRNA gene expression underappreciated. The classic model — DNA to RNA to protein — may not hold true in the presence of mutated DNA, making DNA mutation profiling insufficient for predicting cancer behavior and outcomes.
We have dedicated over a decade to mRNA expression as a vital biomarker in oncology and other diseases. Tumor tissue has long been the gold standard, but inter- and intra-tumor heterogeneity can mislead, and poor-quality nucleic acids make many samples unusable. Liquid biopsies are a less invasive alternative — and we are exploring saliva as a complementary medium.
Wren’s proprietary collection tube stabilizes mRNA from whole blood, capturing a comprehensive spectrum of liquid biopsy information without the degradation risks of traditional methods.
Patterns invisible to the human eye.
Whole exome, transcriptome and genome sequencing generate datasets that exceed human interpretive capacity. Machine learning finds the intricate patterns that matter.
Earlier detection
ML enhances early disease detection and improves diagnostic accuracy.
Smarter IVDs
Analyzing genomic sequences and expression profiles, ML identifies overlooked patterns — building better predictive models for detection and treatment monitoring.
Personalized plans
Facilitates personalized treatment plans built on each patient’s tumor biology.
From unmet need to clinical decision.
Our R&D team — experts in biology, pathophysiology, transcriptomics and AI/ML — follows a structured path to clinically validated in vitro diagnostics.
IUO / IDE for CDx
Investigational-use assays supporting companion diagnostic programs.
For clinical decisions
Validated tests that inform patient care.
LDT for early-phase trials
Laboratory-developed tests to select and stratify patients.
Visualizing what changes — and where.
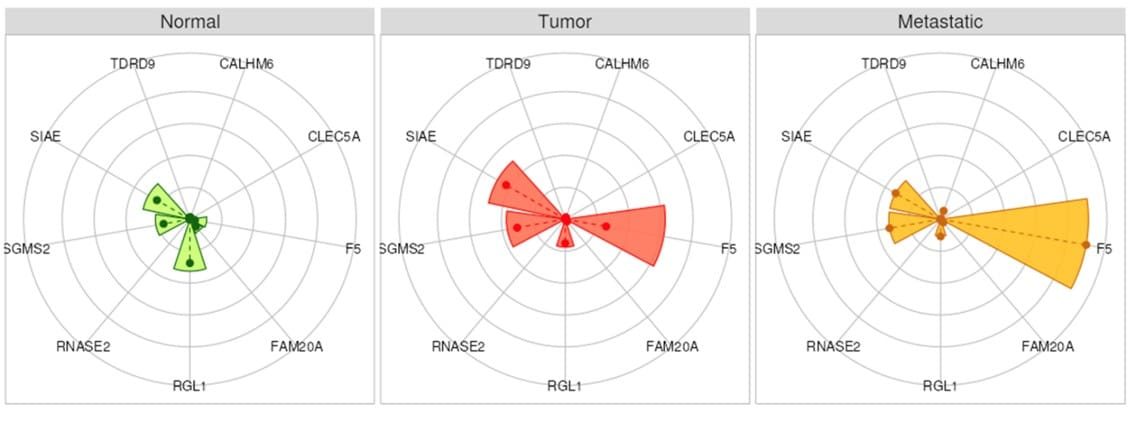
We analyze RNA sequencing data to explore differential gene expression across patient populations — for example, between partial responders and non-responders to specific prostate cancer therapies.
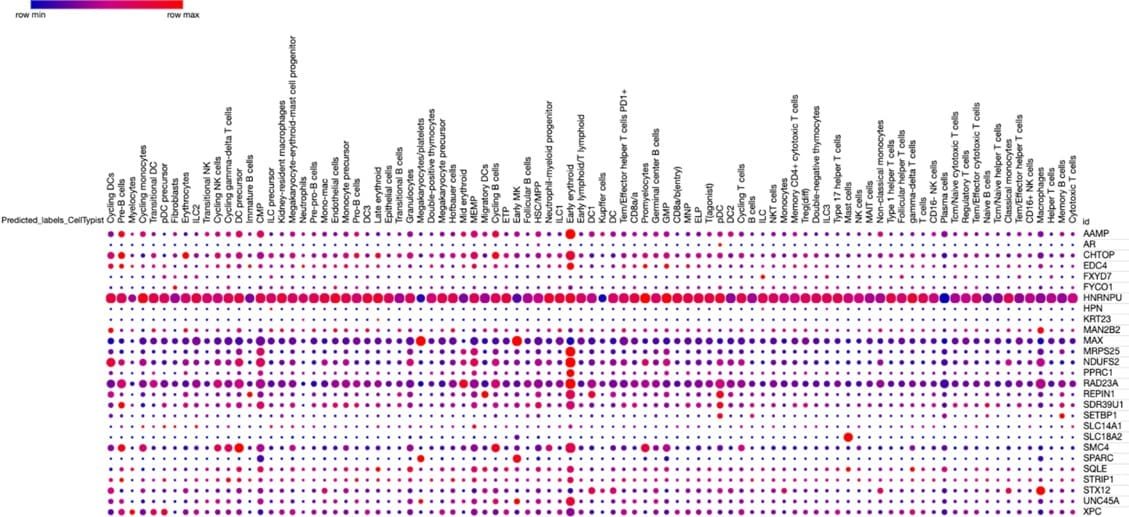
Volcano plots
Highlight differential gene expression quantitatively, showcasing patterns between patient groups.
Circos plots
Show the chromosomal distribution of differentially expressed genes — up- and down-regulated across patients vs controls.
From genes to biology.
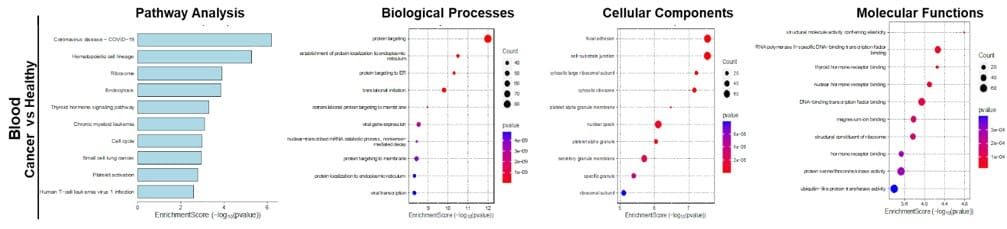
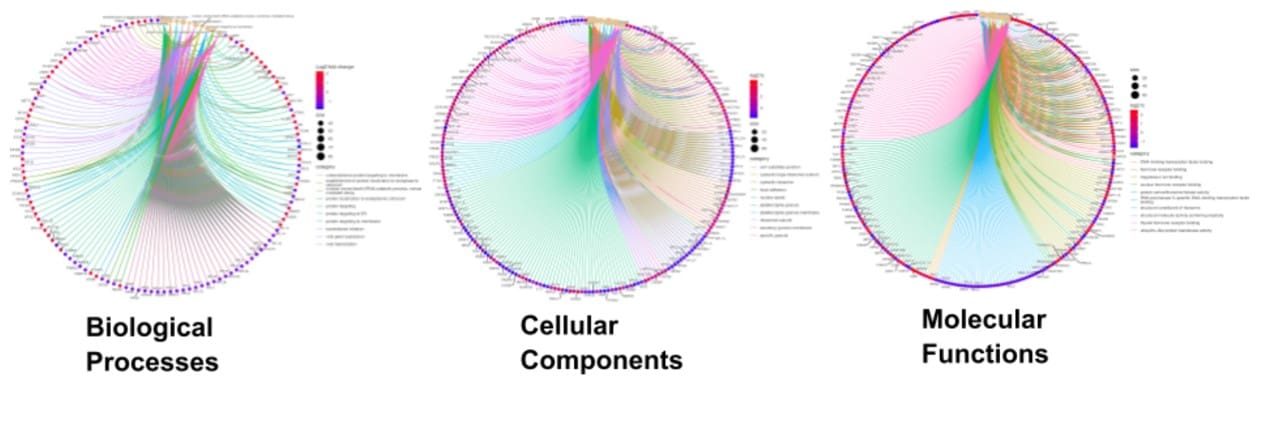
We map differentially expressed genes to biological processes, cellular components and molecular functions — revealing affected pathways such as hematopoietic lineage and cancer mechanisms.
Where every test stands today.
We are developing diagnostics for colorectal, pancreatic, lung, breast, melanoma and myeloma, plus non-cancer diseases such as endometriosis.
| Test | Development | RUO | Exploratory clinical study | Full analytical validation | Clinical validation | CLIA/CAP permission | NYS approval | FDA |
|---|---|---|---|---|---|---|---|---|
| NETest — Blood | ||||||||
| PROSTest — Blood | ||||||||
| COLOcheck — Blood | ||||||||
| Multiple myeloma — Blood | ||||||||
| Pancreatic — Blood | ||||||||
| Melanoma — Blood | ||||||||
| Breast — Blood | ||||||||
| Lung — Blood | ||||||||
| Endometriosis — Blood | ||||||||
| Solid tumors — Saliva* |
*Breast, CRC, lung, melanoma, pancreas and prostate. Stage reached as shown on Wren’s pipeline chart (April 2026).
Medical devices
| Device | Development | Validation for limited use | FDA EUA for limited use | Validation for general use | FDA clearance for general use |
|---|---|---|---|---|---|
| Blood collection tube for RNA and DNA | |||||
| Saliva collection tube for RNA and DNA |
Build your next biomarker with us
From custom gene panels to companion diagnostics — talk to our team.